What Is a Knowledge Graph?
- Pratik Kulkarni
- AI , Cloud Architecture
- 19 May, 2026
- 03 Mins read
A knowledge graph stores information as entities and the relationships between them — not rows and columns, but a web of connected facts.
The Idea Is Simple
Three building blocks:
- Nodes — entities. A person, a company, a product, a regulation, a drug. Anything that can be the subject or object of a fact.
- Edges — relationships between entities. “reports to”, “approved by”, “part of”, “caused by”. The relationship has a direction and a type.
- Properties — attributes on nodes and edges. A timestamp, a source document, a confidence score, a severity level.
A knowledge graph is a collection of (node → relationship → node) triples, each optionally decorated with properties.
You Already Use Them
Knowledge graphs aren’t a new idea — they’ve been running at scale for over a decade in systems you use every day.
Google introduced the Knowledge Graph in 2012 with a deliberate framing: “things, not strings.” When you search “Elon Musk” and see his companies, his roles, and related people in the info box on the right — that’s the graph. It traverses connections between entities that were modeled explicitly.
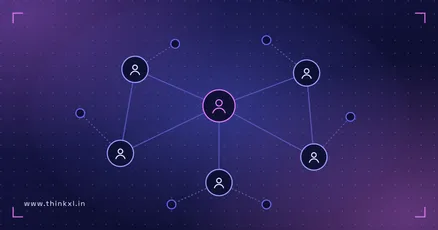
LinkedIn works the same way — people, companies, jobs, schools, and skills are all nodes. The relationships between them are the edges. “People You May Know” and job recommendations are graph traversals over that network.
GitHub’s Dependency Graph maps which packages your project depends on and which repos depend on your packages. When a CVE drops and Dependabot files alerts across thousands of affected repos automatically, it’s walking that graph.
Stripe Radar connects cards, devices, email addresses, and accounts across their network to detect fraud. A fraudster reusing the same device across multiple accounts creates a pattern that only appears when you look at the relationships between those accounts.
In each case, the value comes from the relationships, not the data points themselves.
Why Building One Was Hard (and how AI changed that)
If knowledge graphs were this powerful, why didn’t every company have one?
Because building one was genuinely difficult. The barrier was getting data in. Structured sources were manageable but unstructured sources — CVs, project briefs, meeting notes — needed either manual data entry or custom NLP pipelines for every source. That was expensive and brittle enough that most organisations couldn’t justify it.
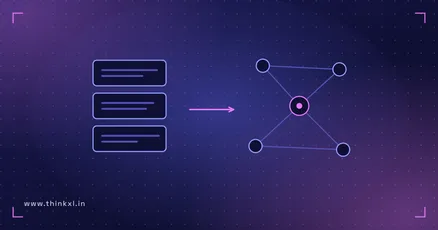
LLMs turn entity extraction into a prompt. Give an LLM a document and ask it to extract entities and relationships in a structured format. The extraction pipeline that used to be a dedicated engineering project is now a few dozen lines of code.
The whole pipeline became automatable. Amazon Bedrock Knowledge Bases takes this to its logical end: point it at an S3 bucket of documents and it automatically extracts entities, builds the graph, and makes it queryable — without you writing a line of graph code.
So a small team can now spin up a knowledge graph. Making it useful in practice remains a bit of a challenge — and Ontology design is the solution.
What That Means for AI Products
A knowledge graph gives your AI system a structured, auditable model of the facts it’s reasoning over — something a vector store alone doesn’t provide.
Every answer can be traced to specific nodes and edges. The same entity is represented once, rather than being scattered across text chunks. Relationships between facts are explicit, so the AI traverses them rather than guessing at them.
That traceability is what makes AI systems built on knowledge graphs reliable, traceable, and verifiable:
- Reliable: the graph enforces consistency — contradictory facts can’t coexist as duplicate embeddings.
- Traceable: every inference has a path through named nodes and typed edges you can inspect.
- Verifiable: when an answer is wrong, you can trace it back to the exact nodes it came from and check whether those facts are correct.
For AI systems moving from prototype to production — especially where wrong answers have real consequences — those properties matter more as the stakes increase.
Conclusion
Knowledge graphs aren’t new; they just became easier to implement. When your AI system needs to reason over facts that have relationships — who reports to whom, what depends on what, which regulation applies to which product — a graph is the right data structure because it matches the shape of the problem.
What changed recently is that building one stopped requiring a dedicated team. LLMs handle the extraction. Managed services handle the infrastructure. The hard part now is deciding what your graph should actually model — and that’s a design problem, not an engineering one.
If you want to see what this looks like end-to-end, the Engineering Resource Management with Knowledge Graphs on AWS post walks through a real example with a working demo and code you can run yourself.
For teams building on AWS, there are four distinct ways to run knowledge graphs — managed Neptune, Neptune Analytics, Bedrock Knowledge Bases, and self-hosted Neo4j — each with different fit and cost trade-offs.